

Figure 1
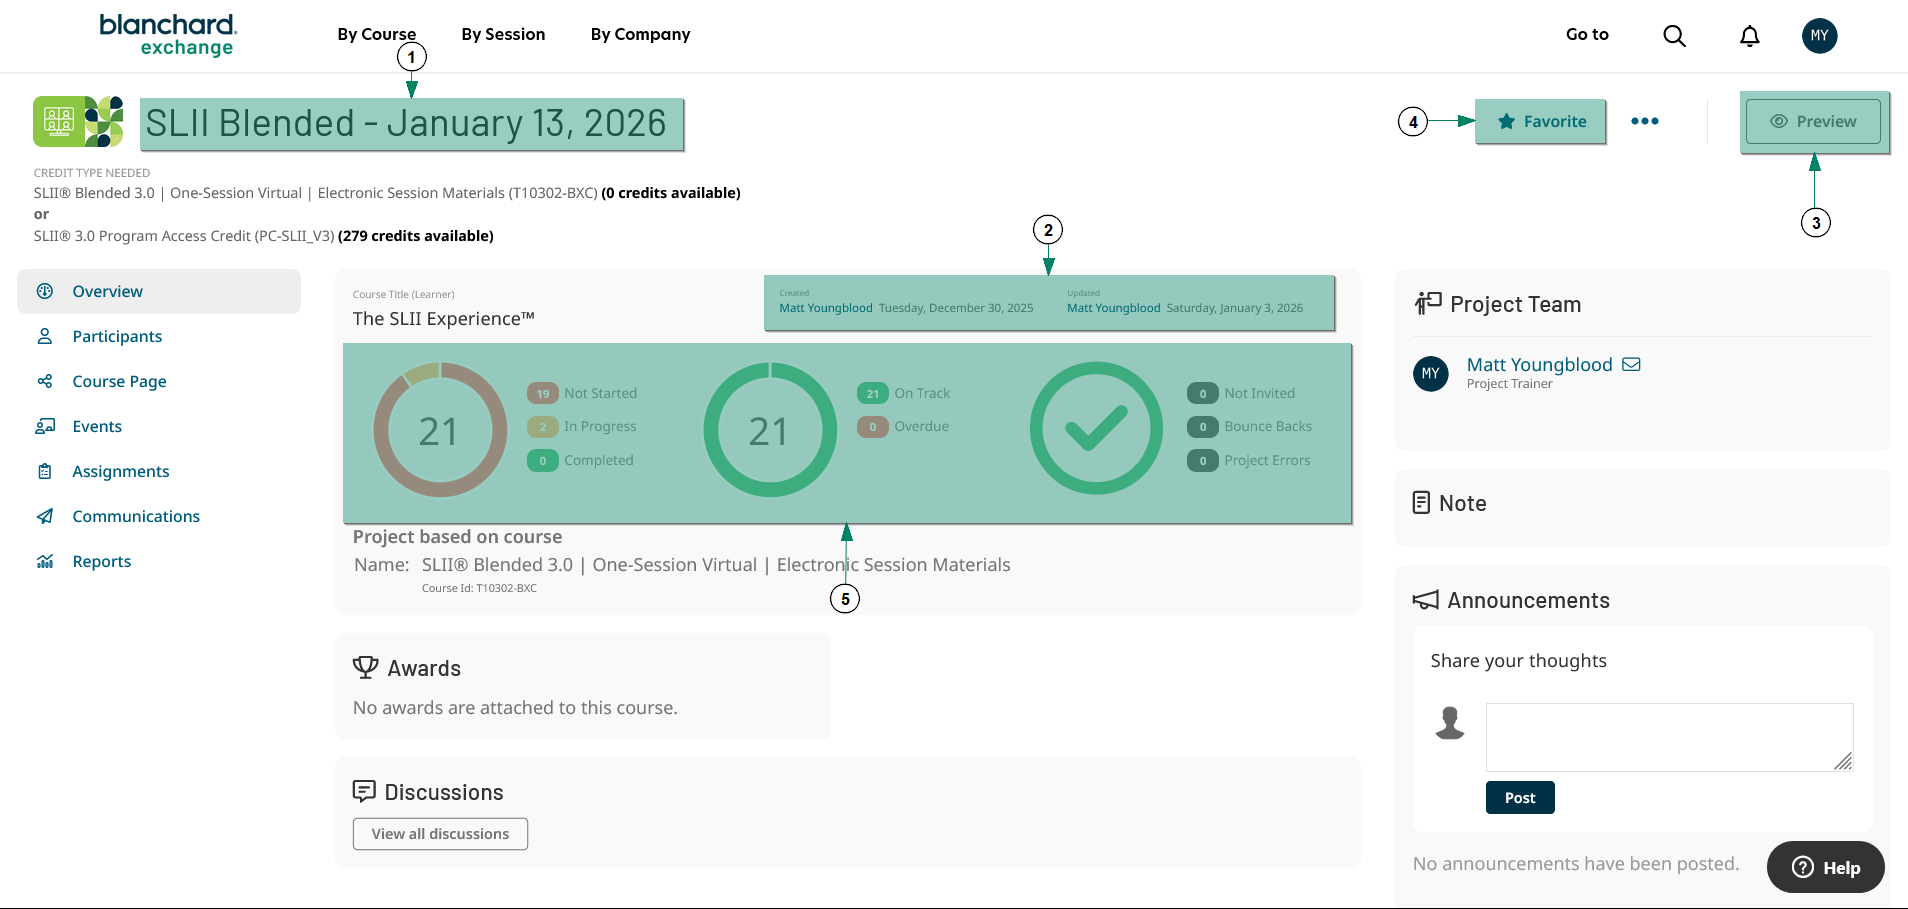
The project overview screen displays a variety of information, including the following:
Project name – The name entered by the administrator (Figure 1-1).
Last updated information – Displays the most recent date the project was created or updated, along with the administrator who set up the project (Figure 1-2). You can email the Project Administrator directly using your personal email by selecting their name.
Preview button** – Allows you to view the course as a learner (Figure 1-3).
Integrated Blanchard products, such as online assessments, are not accessible in this view. If you do not already have learner access to these products and need to preview them, an administrator in your organization must assign credits to you so you can be added as a learner.Star icon – Selecting this icon marks the project as a favorite and adds it to your list of favorite projects (Figure 1-4).
-
Completion summary – Displays overall completion rates with a breakdown of the following statuses (Figure 1-5):
Not Started – The number of participants who have not started the course.
In Progress – The number of participants who have begun but not yet completed the course.
On Track – The number of participants who are meeting assignment deadlines.
Overdue – The number of participants who have missed one or more assignment deadlines.
Completed* – The number of participants who have completed all assignments within the course.
Completion rates are calculated based on the entire course, not just prework. Some courses include additional fieldwork assignments or post-session resources that continue to be tracked after training events. The On Track indicator provides the best overall snapshot of learner progress against assignment deadlines.
The project overview screen also includes icons to access additional project details (Figure 2):
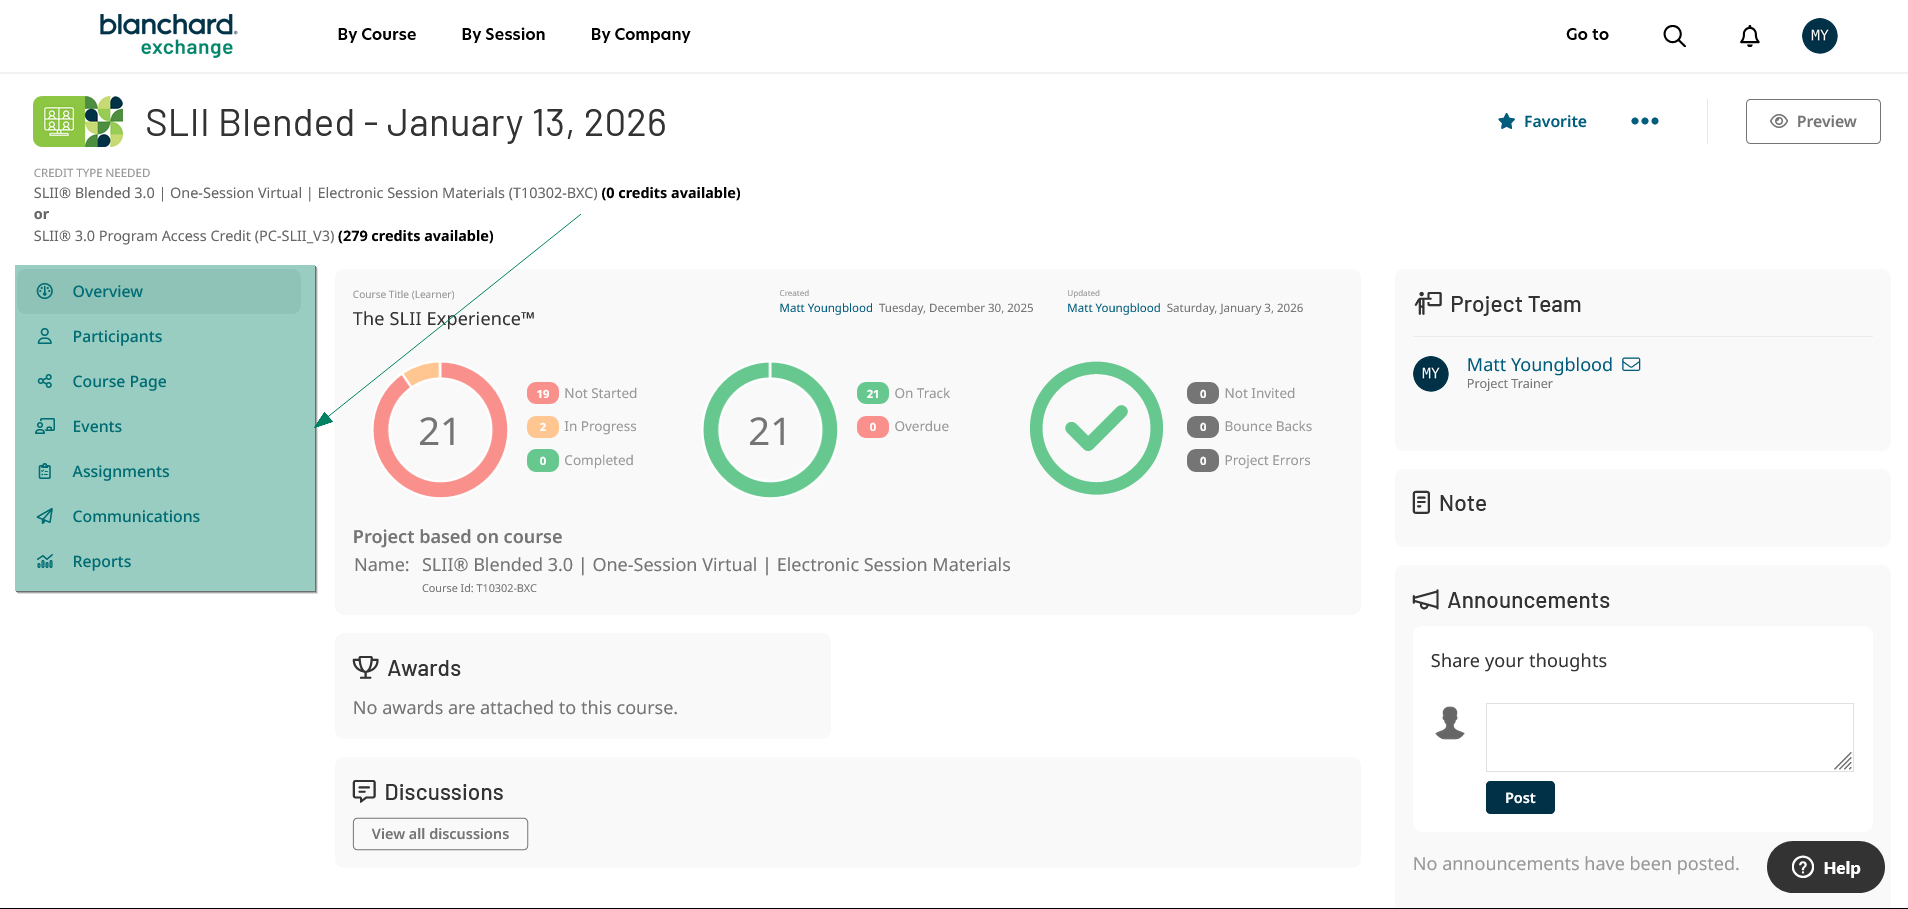
Figure 2
- Participants
- Course Page
- Events
- Assignments
- Communications
- Reports
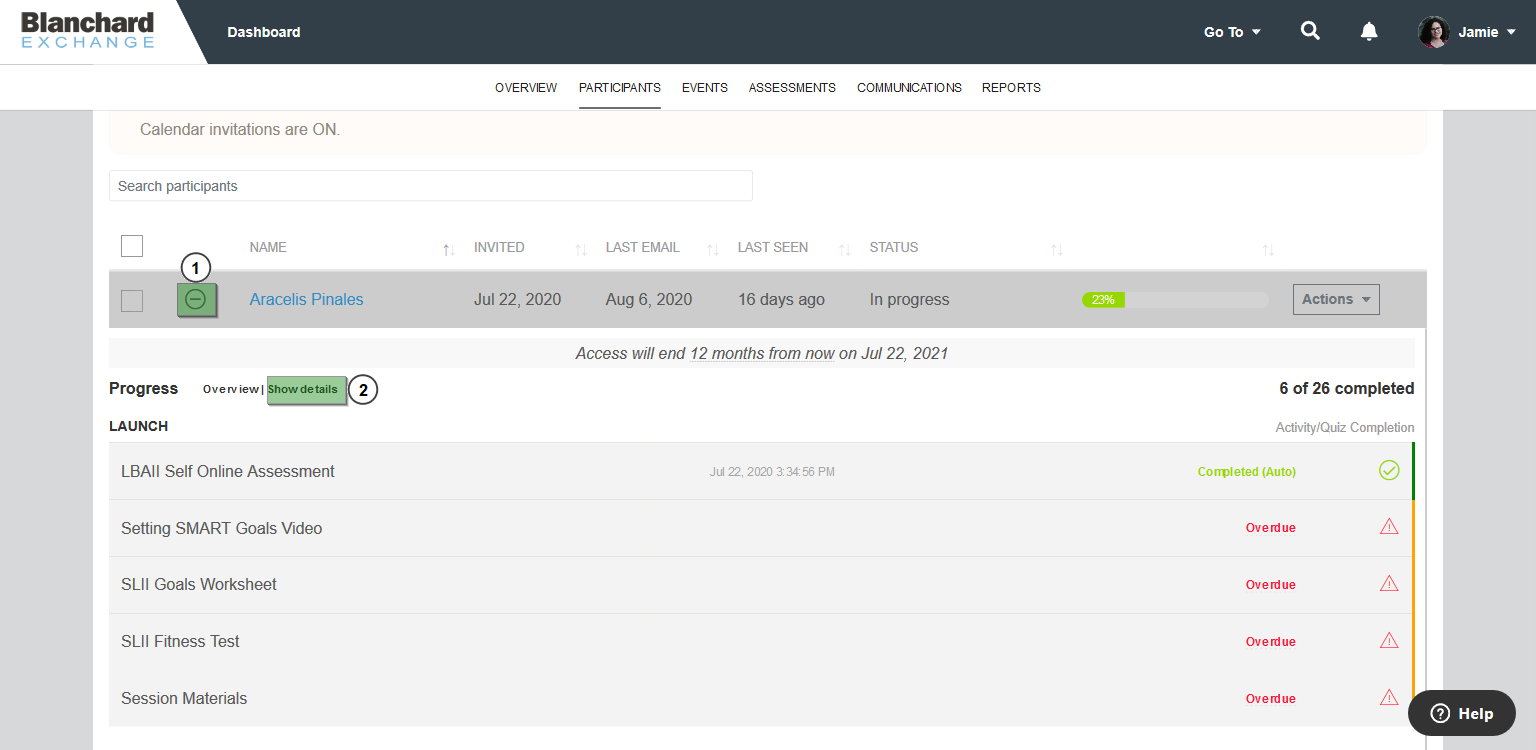
Figure 3
Participants: Displays the roster of participants associated with the project. The following information is shown for each participant:
The participant’s name
The date the participant was initially invited to the course associated with the project
The date of the most recent email communication sent to the participant
The last date and time the participant accessed the course
The participant’s overall course completion status
A percentage indicator based on assignment completion. Note that this indicator also includes optional assignments. As a result, a learner may have a status of Completed without showing 100% assignment completion if optional content is not completed.
Individual assignment completion details can be viewed by selecting the + icon to the left of a participant’s name (Figure 3-1). You can also view expanded completion details by selecting the Show details option at the top of the participant’s progress section (Figure 3-2). This view expands course activity names to show all individual assignments.
Additionally, if the course includes an integrated assessment such as the Team Assessment or Change Scan, and the participant has completed the assessment(s), the learner’s feedback report(s) are accessible at the bottom of their assignment progress. Reports for the entire group can also be downloaded by following the instructions provided later in this article under the Assignments section.
Events: Displays live event details associated with the course. If calendar invitations are enabled for the project, this screen shows the recorded response summary totals (Accepted, Declined, Tentative, or No Response) for each learner and each live event associated with the project (Figure 4). These summary totals can be selected to see each learner under each category.

Figure 4
Assignments: Lists any integrated assessments, such as the Team Assessment or Change Scan, and provides options to download feedback reports in bulk. This tab can also be used when a course includes the Assignment Upload feature, allowing you to view assignment submissions or evaluate assignment status when the evaluation feature is enabled.
Communications: This section provides a record of scheduled communications, including both previously sent and upcoming communications, and displays the project’s communication history.
To see a list of communications that have been scheduled, select the Scheduled Tasks sub-tab. To see the actual communication history in terms of the email subjects/bodies as well as the recipients, select the Communication History sub-tab.
The following columns will be displayed:
Recipients – Displays the number of recipients who received the communication and includes a link to view the communications sent to each learner (Figure 5).
Channel – Indicates the delivery channel used for the communication (currently Email in all cases).
Triggered – Indicates whether the communication was sent Automatically (by an automated communication rule) or Manually (sent by an administrator).
When – Displays the date and time the communication was triggered.

Figure 5
Reports: This screen provides project-level reporting. Note that both Live Reports, which generate on the fly, and Scheduled Reports, which may take longer to process, are available. Scheduled reports can be generated and accessed later by selecting the Generated report button, while Live Reports are not stored for later access.
The following project reports are available:
Participant Status: View group and participant completion status for individual course activities.
Participant Status – Simple: View a high-level summary of course completion along with key dates.
Participant Status – Detailed: View expanded completion details for all individual assignments and files. This report shows the modules and activities that contain each asset, along with their completion statuses.
<Program Name> Challenge: View progress for individual challenges that have been completed. These reports are available only for certain Blanchard program offerings. If the course does not include a Challenge product, this report will not be listed.